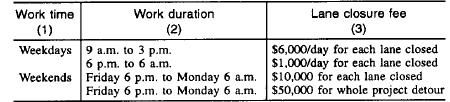
In the tool, there is an option called ‘Cost Catalog’ (as shown in Fig 2 below) where the user will be able to view all the above information.
Figure 2: Cost Catalog
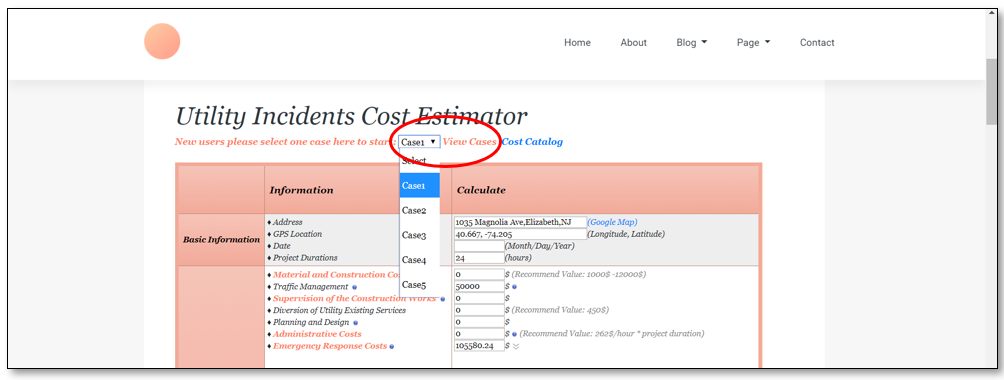
VIEWING PAST CASES
The research team had invested in up to twenty-five case studies for an in depth understanding of types of costs associated with utility strikes and the range of these costs. Five of the cases out of the twenty-five have been uploaded into the webtool (please see Fig 3 below) for user’s reference. These cases range from highest monetary values (Case 1 and Case 2) to the lowest (Case 5).
Figure 3: Viewing past cases
First step is to select the case that the user would like to view from the dropdown list and then click on ‘View Cases’ (circled in Fig 3 above). After selecting the case, the user can view through all the all the types of costs associated with that incident and then finally click on ‘Calculate Total Cost’ to display the total cost (sum of direct, indirect and social costs). For instance, the total cost for Case 3 comes up to $870,878.64 as shown in Fig 4 below.
Figure 4: Total cost for Case 3
The user can extract values from these case studies and enter them into their incident true cost. The final value does not have to be exact; the tool is solely to aid the utility industries and municipalities on the overall impact of a utility strike.
HOW DOES THE COST ESTIMATOR TOOL WORK?
Case Study BackgroundAn explosion and fire at a house in New Brunswick, New Jersey was caused by a gas leak. The fire was in 211-227 George Street, in the heart of New Brunswick city. The explosion was heard around 10:45am. A two-story house was collapsed. No one was killed or injured in the blast. The fire chief says that an excavator struck the gas line causing the house to explode. Investigators mentioned that the mark-out was insufficient. This gas line was present under ROW. The explosion also caused the overhead electrical wires to burn out and there was power outage for almost 2 hours. The local businesses and residences did not have supply to gas for around two days. Summary of Police Report:There were five 2000 GPM fire trucks at the site. Three 210hp ambulances and eight police automobiles. There were around five captains, operator each and ten fire firefighters. Three ambulance drivers and six paramedics. Finally, there were around sixteen police officers, including detectives, sergeants, and so on. Location Profile:Local businesses included restaurant, pharmacy, grocery store and beauty salon. Around five residences and five businesses were affected due to this incident (with an average income of $65,000). The roadway consisted of a two-lane urban roadway. Pedestrian traffic is slightly heavy, therefore, walking business was significant. Pedestrian traffic flow is very low. Repair Work:The method consists of excavating 5 pits to access the pipe buried at an average depth of 1.8m below grade. The pit areas varied from approximately 4m2 to 8m2 and were typically located at all intersections, fire hydrants and valves. The project was completed in 4 working days. The working hours were typically from 9:00 a.m. to 3:00 p.m. The material and construction cost of the project amounted to $12,000. Excavated volume is around 1000m3 and pavement cut and restored length is around 200m. |
For a better understanding on how the tool works, let us consider a hypothetical case:
Total Cost Analysis
The total cost of the project will be estimated using the total cost evaluation tool. This section will provide a step-by-step method on how to use the tool and achieve the total cost that involves direct, indirect and social cost.
Basic Information:
At first, the user would start off by entering basic information about the incident in the tool, as shown in Fig 5. In our case study, the Address would be: “211 – 227 George Street”; GPS Location: “40°29'21.9"N 74°26'29.2"W”; Date: “11/11/2018”; Project Duration: 4 days = “96 hours”.
Figure 5: Basic Information
Direct Cost
Material and Construction Cost
The user can enter the total amount according to their respective project OR enter a recommended value which is between $1000 and $12,000. In this case, the amount comes up to $12,000.
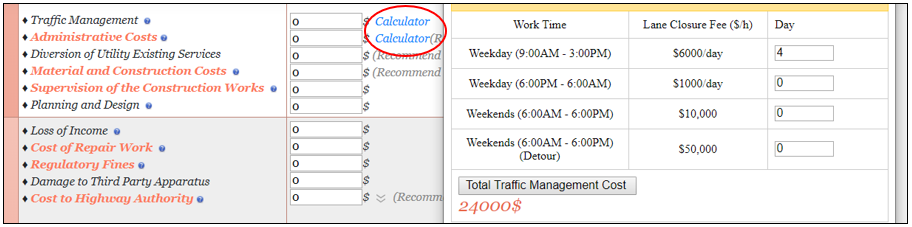
Traffic Management
Traffic Management Cost is the sum of Lane Rental Cost and Traffic Control Devices Cost. As you point your arrow towards the blue question mark, there is a list of few recommended values. In our case, since the work was from 9:00 a.m. to 3:00 p.m. during the weekdays for four days. The total cost can be valuated from the calculator as shown in Fig 6, the lane rental in our case is 6000 x 4 = $24,000
Figure 6: Recommended values for Lane Rental
Diversion of Existing Utility Tool
The user can enter a value of their own or a recommended value of $450.
Administrative Cost
Assuming that for this case there were one Sr. Engineer, one Manager, two Operators and one Compliance Officer, the total hourly rate for all the staff members would be 74 + 61 + 30 + 30 + 41 = $236/h. The user can use the calculator (similar to Fig 6) to calculate the overall administrative cost. The total value of their work would be 236 x 96 (project duration) = $22,656
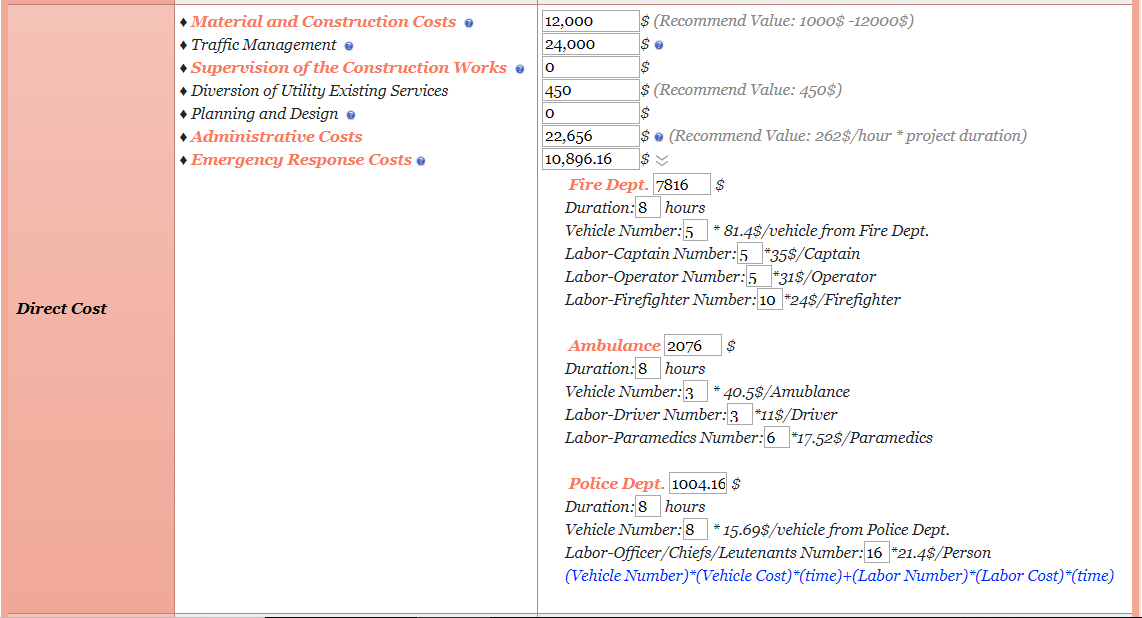
Emergency Response Cost
The user would just have to enter the number of hours the responders were at site and the number of trucks and personnel. The total cost will be automatically evaluated as shown in Fig 7 below. If the user wants to add their own total emergency responders cost then it can be entered manually as well.
In our case study the total emergency responders cost comes up to $10,896.16
Figure 7: Direct Cost
Therefore, the total value of the direct cost is $70,002.16
Indirect Cost
Loss of Income
This varies from case to case, person to person and business to business, the user would have to enter a value based on their research or make an educated guess. For this case, the average annual income for all the five businesses were $65,000. One way to calculate the loss of income would be $65,000 x 5 = $325,000. Therefore, their monthly and daily income would be $27,083.33 and $902.78. Since the gas was out for two days, loss of income for the two days for all five businesses joined will be 902.78 x 2 = $1,805.6.
Regulatory Fines
Since there is no schedule of fines given for utility damages, one way to enter an amount would be by referring to the past cases in the tool. Since it is a house explosion due to insufficient mark-out, this case could be compared to Case 4 from past cases, possible fine could come up to $75,000.
Costs to Highway Authorities
For cost of reduction in pavement life, the user just must insert the length of road under repair work as shown below in Fig 8. In our case study, since 200m is under repair work, the total cost will come up to $22,000.
Figure 8: Costs to Highway Authorities
Loss of Parking Revenues
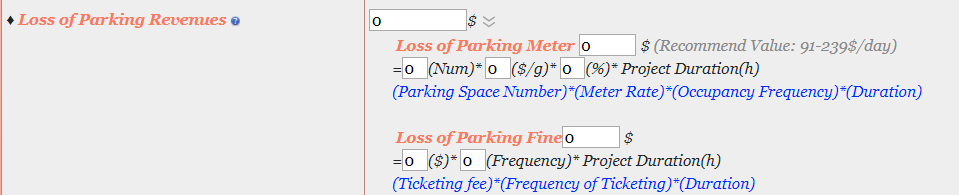
If the user is unaware of the occupancy frequency, then the recommended value $91 - $239/day can be entered. In this case study, since there are no metered parking spaces, the value will remain zero as shown in Fig 9.
Figure 9: Loss of Parking Revenues Cost
Repair Costs
For adjacent buried utility damage cost, the user just must enter the excavated volume and the material and construction cost. Therefore, in this case study the buried utility damage repair cost will be $53 (refer Fig 10 below).
Figure 10: Repair Costs
Therefore, the total value of indirect cost is $98,858.6
Social Cost
Costs to Business
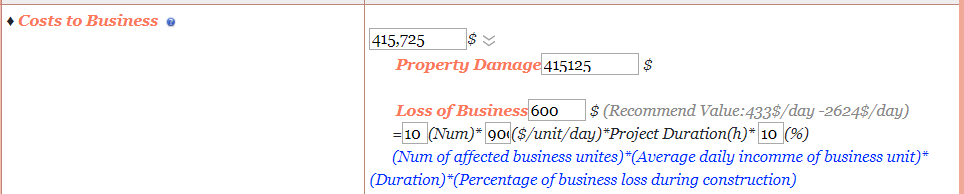
Cost to Business is a sum of income lost for the business and property damage. Since the value of property damage varies from case to case, one way to enter this amount would be by referring to the past cases in the tool. Since the case is a house explosion, this case could be compared to Case 4 from past cases, the amount could come up to $415,125.
For loss of business, let us assume that there was 10% reduction due to this incident. Therefore, the loss of income can be calculated using the below formula shown in Fig 11. The total costs to business are 415,125 + 600 = $415,725
Figure 11: Cost to Business
Cost to Highway Users
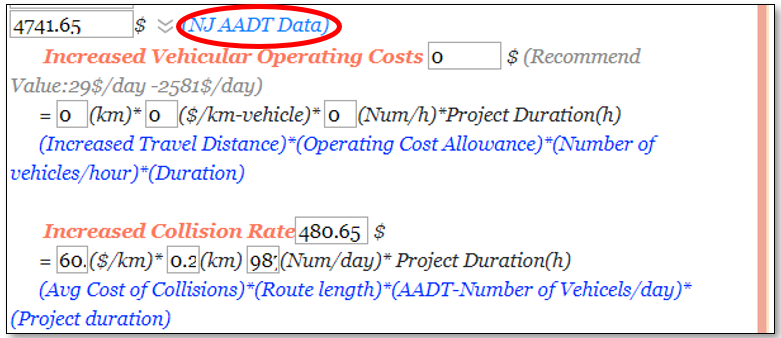
For Increased Vehicular Operating Cost, since there are no detours in this case the value will come up to zero. For Increased Collision Rate, the average increase in collision rate for urban vehicles are 60.86/1000 veh-km and AADT can be found from the link circled in the Fig 12 below. In this case, the value of the increased collision rate would be $480.65. For traffic delay cost, since travel time during normal conditions and travel time during controlled time is unknown, an average number of the recommended values can be considered in this case, which comes up to $4261. Since, the pedestrian flow is very low, the value can be considered as zero. Therefore, the total cost to Highway Users come up to $4741.65.
Figure 12: Cost to Highway Users
Environment Costs
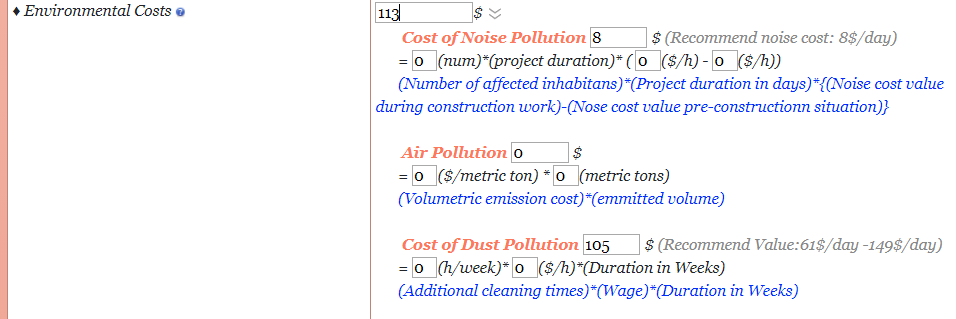
The user would have to input all numbers required in the formula or can consider any of the recommended values as shown in Fig 13 below, in this case the recommended values are inputted.
Figure 13: Environmental Costs
Therefore, the total value of the social cost is $420,579.65.
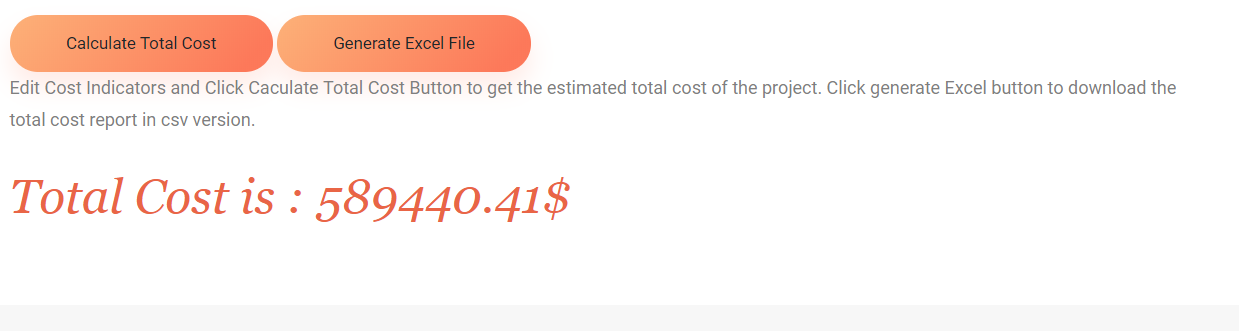
Once all the values have been entered, the user can click on the ‘Calculate Total Cost’ to attain the total cost and can also click on ‘General Excel File’ for a proper breakdown of the costs. Refer below Fig 14 below for the overall cost.
Figure 14: Sum of Direct, Indirect and Social Cost
Therefore, the total cost of the utility repair work is $589,440.41
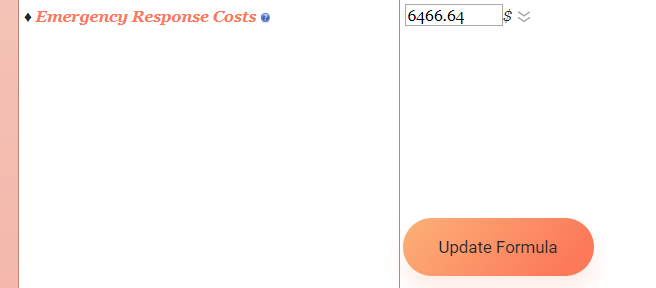
If the user wants to find a value for an individual cost category or sub-categories, the user can enter the values and then click the ‘Update Formula’ on the right side of the web page link as shown below in Fig 15.
Figure 15: Update Formula Link